Carlos Escudero
CE

Carlos Escudero

Finance & Business Intelligence Analyst

MBA Candidate USMC Veteran Google Certified Data Analyst

About Me

I am a U.S. Marine Corps veteran turned finance and analytics professional. Currently, I am an MBA candidate in Business Intelligence at the University of Houston-Downtown (4.0 GPA), specializing in FP&A and decision support.

My experience spans from managing complex client relationships at Steris Corporation (where I reduced downtime by 25% via data analysis) to supporting a $2M operating budget at KIPP Texas. I bridge the gap between technical data and executive strategy.

I don't just build dashboards; I build tools that answer business questions, optimize costs, and drive operational efficiency.

Career Vision & Goals

I am building a career in Finance and Business Intelligence where I analyze data, guide strategy, and support leaders with clear financial insights. My focus is on growing into FP&A and BI roles that blend analytics, storytelling, and operational impact, while staying aligned with my long-term vision for stability and growth.

Working toward this through my MBA, hands-on projects, and consistent skill development.

Technical & Core Competencies

Data Analytics

2+ Years Experience

Power BI (DAX), Tableau, SQL, Excel Modeling. Google Data Analytics Certified.

Finance & Strategy

7+ Years Experience

Budgeting ($2M+), Forecasting, Variance Analysis, Cost Optimization (Steris & KIPP).

Leadership

USMC Veteran

Strategic planning, accountability, cross-functional team leadership, and mentorship.


Featured Projects

Select a project below to view the full analysis, methodology, and insights.

Power BI | HR Analytics

Employee Turnover Diagnostics

Investigated involuntary dismissals across global regions. Identified critical risk in Logistics & Production within the first 3 years.

Turnover Dashboard

Python & Tableau | Consumer Insights

Beer Consumer Preferences

Analyzed ratings of top vs bottom breweries to determine flavor drivers. Discovered that "Balanced Fruit & Hop" profiles drive highest satisfaction.

Beer Analysis

Excel Modeling | Real Estate

Property Value Drivers

Analyzed 2,100+ home records. Proved that Square Footage explains 87% of price variance, debunking myths about airport proximity impact.

Real Estate Analysis

Financial Modeling | Strategy

Valero vs PBF Energy
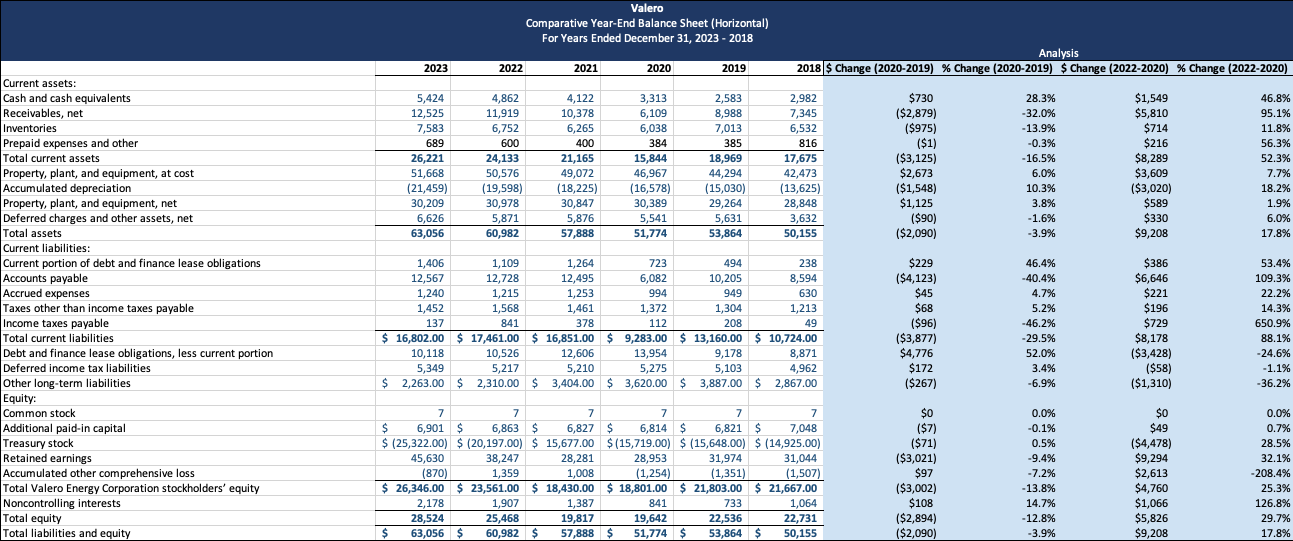
Comparative solvency and cash flow analysis (2018-2023). Valero demonstrates superior liquidity and stable dividends compared to PBF.

Financial Analysis

Get In Touch

I am currently open to opportunities in FP&A, Business Intelligence, and Financial Analysis. Let's connect!

© 2025 Carlos Escudero. All rights reserved.
Power BI DAX Excel Data Cleaning

Employee Turnover Diagnostics

Investigating Involuntary Dismissals & Retention Risk

The Analysis Approach

I consolidated separation data for 687 employees to identify structural turnover drivers. Using Excel for data cleaning and Power BI for visualization, I segmented employees by tenure, manager, and region to move beyond generic turnover rates. This project directly mirrors my work at KIPP Texas, where I aggregated data to validate leadership initiatives.

5 Business Questions Answered

  • 1. Is turnover widespread or localized?
    Answer: Localized. Two specific managers drove 20%+ of exits.
  • 2. At what tenure are we losing people?
    Answer: Critical risk is within the first 1-3 years (Onboarding gap).
  • 3. Which functions are bleeding talent?
    Answer: Logistics & Production roles in the Americas.
  • 4. Is the turnover voluntary or involuntary?
    Answer: Primarily involuntary, suggesting hiring misalignment.
  • 5. What is the financial impact?
    Answer: High retraining costs focused in the manufacturing division.

Key Takeaways

  • Identified Gaps: Structural onboarding issues in the first 12 months.
  • Manager Action: Recommended targeted coaching for 2 specific lead managers.
  • Strategy: Proposed a "First 90 Days" mentorship program for Logistics hires.
Python Clustering Tableau

Beer Consumer Preference Analysis

Determining the Flavor Profiles that Drive 5-Star Ratings

The Analysis Approach

Using Python for cluster analysis and Tableau for visualization, I analyzed dataset ratings for top and bottom performing breweries. The goal was to quantify "Taste" by breaking it down into specific flavor attributes like Fruit, Hops, and Sweetness.

5 Business Questions Answered

  • 1. Which attribute correlates most with high ratings?
    Answer: Taste is the #1 driver, specifically "Fruit" notes.
  • 2. Is there such thing as "too sweet"?
    Answer: Yes. Sweetness has diminishing returns; balance is key.
  • 3. Do higher alcohol contents (ABV) improve ratings?
    Answer: Weak correlation. Flavor profile matters more than strength.
  • 4. What is the optimal complexity?
    Answer: ~140 flavor units. Beyond that, consumers get confused.
  • 5. What should we brew next?
    Answer: A balanced IPA with strong citrus/fruit notes, not pure sugar.

Key Takeaways

  • Flavor > Strength: Consumers prefer complex flavor profiles over high ABV.
  • The Sweet Spot: Sweetness must be balanced with Hops to avoid "cloying" complaints.
  • Action: Prioritize fruit-forward hop varieties in the next production cycle.
Excel Regression Analysis Zillow Data

Real Estate Value Drivers

Analysis of 2,100+ Homes in Salinas & Watsonville

The Analysis Approach

I performed a regression analysis on housing data to determine what actually drives price. Specifically, I wanted to test the hypothesis that "proximity to the airport lowers property value." This required cleaning a large dataset and building a model to isolate variables like square footage, year built, and location coordinates.

5 Business Questions Answered

  • 1. Does living near the airport hurt home value?
    Answer: No significant negative correlation found in this dataset.
  • 2. What is the #1 predictor of price?
    Answer: Square Footage (explains 87% of variance).
  • 3. Is there a "New Construction" premium?
    Answer: Yes, but only when normalized for lot size.
  • 4. Which city offers better value per sq ft?
    Answer: Salinas ($105/sqft) vs Watsonville ($191/sqft).
  • 5. Should we invest in airport-adjacent lots?
    Answer: Yes, if the school district is strong (Schools > Noise).

Key Takeaways

  • Size is King: Renovations adding square footage yield highest ROI.
  • Location Myth: Airport noise impact is overstated compared to school quality.
  • Market Arbitrage: Salinas represents a clear undervaluation opportunity.
Financial Modeling Ratio Analysis Strategy

Valero vs PBF: Strategic Financial Analysis

Solvency, Liquidity, and Cash Flow Evaluation (2018-2023)

The Analysis Approach

I built comparative financial models for two major energy firms to evaluate business fundamentals. I specifically analyzed liquidity and solvency ratios to determine which company was better positioned to handle market volatility and return value to shareholders. This aligns with my background managing budgets at KIPP Texas, where forecasting accuracy is critical.

5 Business Questions Answered

  • 1. Which company is more solvent?
    Answer: Valero (Implied interest rate ~1.5% vs PBF's ~2.8%).
  • 2. Who handled the 2020 crisis better?
    Answer: Valero maintained liquidity; PBF faced high volatility.
  • 3. Is the dividend sustainable?
    Answer: Valero: Yes (Stable). PBF: No (Likely cuts in downturns).
  • 4. Where is the cash coming from?
    Answer: Valero generated $10B+ surplus from ops vs PBF's negative cash flow years.
  • 5. What is the strategic recommendation?
    Answer: Buy Valero for stability; Avoid PBF until debt reduces.

Key Takeaways

  • Diversification Wins: Valero's Renewable Diesel arm provided a crucial buffer.
  • Debt Discipline: PBF's aggressive risk profile makes it vulnerable to interest rate hikes.
  • Action: Recommended "Hold/Buy" on Valero, "Sell" on PBF.